


WHY MINERALS ARE ESSENTIAL
FOR OPTIMAL HEALTH
The elemental building blocks of the universe and everything in it, alive or not, are the mineral and gas elements we have currently identified and probably numerous others we have not discovered yet. Yes, we are in fact a living assembly of all of these elements. New research is demonstrating that optimal health is directly dependent upon an optimal cellular balance of these minerals and gasses. As we are a combination of water and dust.
The minerals play roles in structural support, energy production and proper cellular functioning acting as catalysts for all of the enzymes our cells continuously make in order to do their specific job.
We do not make minerals internally and therefore must consume them either via the food we eat or water we drink.
These sources have become so depleted, that it is virtually impossible to obtain the necessary amounts of minerals we need daily via our daily diets.
Maintaining good cellular levels of all the minerals is essential for optimal cellular and therefore organ functioning. This state yields optimal health.
Eidon provides a comprehensive list of known essential minerals in a liquid, easy to use format and a hair minerals analysis to guide you towards mineralibrium and optimal health.
Featured Articles


The Germ Theory of Disease
(Medicine) Re-analyzed
(Medicine) Re-analyzed
We have come a long way in understanding how the body functions in health and disease. This has resulted in the development of more sophisticated testing and the engineering of many potent drugs.
Our Products
Eidon strives to create the purest products available. We start with pharmaceutical or food-grade raw materials with a purity level of 99.8% or greater. Every raw material that Eidon purchases come with a COA (certificate of analysis). Before using any raw materials in our blends, all are tested by a third-party accredited lab for identity, purity, strength, and for the heavy metals, lead, arsenic, mercury, and cadmium. Each raw material must meet Eidon’s requirements and be within the FDA’s limits of heavy metals before we would accept it for use.
We fully guarantee all of our products purchased on our website. Please call our toll free number with any concerns.
We fully guarantee all of our products purchased on our website. Please call our toll free number with any concerns.
Single Minerals
These essential ionic liquid minerals are naturally derived and simply the mineral elements in purified and de-ionized water, making Eidon safe for all ages!
Liquid Silica
$19.99
$19.99
Of all the minerals important for good health, Silica is by far the most underrated and misunderstood mineral of all. It is the seventh most prevalent element in human tissue after calcium. Research done in the 1970's by Dr. Edith Carlisle at the UCLA...
Liquid Boron
$19.99
$19.99
Known and used by civilizations dating at least back to the time of the Greeks, Boron as borax has a long history. Boron is found naturally in seawater, fruits, and vegetables and is concentrated in some volcanic regions of the world. It was isolated and...
Liquid Calcium
$19.99
$19.99
Calcium, the most plentiful mineral found in the human body, ideally comprises 1.5 to 2% of an adult's total body weight. Every cell and organ in the body depends on Calcium for proper functioning. Teeth and bones contain the majority of the body's Calcium (about 99%), where it is stored for future uses.
Liquid Chromium
$19.99
$19.99
Analysis has shown that unrefined carbohydrates, especially grains, are rich in Chromium and other essential life supporting minerals. The refining of carbohydrates gives them a longer shelf life, however, Chromium and other essential minerals are...
Liquid Copper
$19.99
$19.99
Copper is essential for both Iron and Zinc utilization, as well as for maintaining a strong cardiovascular system. Copper, along with Iron, is necessary to produce hemoglobin (the part of the red blood cell that carries oxygen from the lungs to all the...
Liquid Iodine
$19.99
$19.99
Iodine's primary role is to support a healthy thyroid gland by activating the production of thyroxine, a hormone that is needed throughout the body for energy production. About 50 to 60 percent of the body's Iodine is stored in the thyroid gland, the...
Liquid Iron
$19.99
$19.99
Iron’s primary role in the body is as a component of numerous enzymes and other molecules absolutely essential for health and optimal well-being. The most important compounds are as follows: Hemoglobin is the iron containing molecule found in...
Liquid Lithium
$19.99
$19.99
Lithium is an essential mineral element. Deficiencies can occur due to diet and water sources and may be depleted with the consumption of mercury, aspartame, MSG, BPA and other excitotoxins. Recent research is now discovering numerous applications for...
Liquid Magnesium
$19.99
$19.99
Magnesium plays an essential role in over 300 enzyme reactions in the human body. All refined foods are lacking Magnesium, as well as most other essential minerals. Many Americans eat a highly refined diet and are, as a result, deficient in Magnesium...
Liquid Manganese
$19.99
$19.99
Manganese is an essential element that most people know little about. Adequate tissue Manganese is important for numerous physiological functions. Among those are: Maintaining optimal energy and strength levels Catalyzing the production of SOD...
Liquid Molybdenum
$19.99
$19.99
Molybdenum is an important mineral element now recognized as an essential catalyst for 3 cellular enzymes needed for the breakdown of potentially harmful compounds, normally produced in the body or introduced into the body via food and water. These...
Liquid Phosphorus
$19.99
$19.99
Phosphorus is an essential yet often overlooked element in terms of daily need. While many medical professionals believe adequate levels are available in our diets, it is in fact very questionable that we are getting enough of this critical element...
Liquid Potassium
$19.99
$19.99
Potassium is one of seven inorganic, macro mineral nutrients needed in relatively high daily amounts. It is the third most prevalent element in the body after Calcium. Along with Chloride, Sodium, Magnesium and Calcium, Potassium is an essential...
Liquid Selenium
$19.99
$19.99
Selenium, while little known by the public, is a well-studied element. It is involved as a catalyst in several important enzymes. The most well-known function is in the liver where selenium catalyzes or activates the glutathione peroxidase enzyme. This...
Liquid Sulfur
$19.99
$19.99
Sulfur is essential for collagen synthesis, which equates to healthy joints, smooth skin, glossy hair and hard nails. It is critical to protein utilization and metabolism. Sulfur is found in every cell of the human body and is a crucial...
Liquid Zinc
$19.99
$19.99
Zinc is essential for the maintenance of immune system strength and glandular health. It can be rapidly depleted when the body is fighting an illness. Zinc is the tenth most abundant element in the human body. Zinc is found in all organs, tissues and...
Mineral Blends
Combining minerals can optimize their effect while making it easier to dose.
Multiple Minerals
$19.99
$19.99
Eidon's Multiple Minerals are a complement of all essential and trace minerals necessary for good health in a silica base.In any Multiple Mineral formula, the key to its successful formulation lies in its mineral balance. Minerals work in a precise...
Joint Support
$19.99
$19.99
Eidon Joint Support is a combination of Silica and Sulfur, both essential for joint health. They are the active mineral ingredients in glucosamine sulfate and chondroitin sulfate. Silica and Sulfur are the two most important minerals required by...
Adrenal Support
$19.00
$19.00
Purity You Can See, Taste & Feel. Naturally derived mineral elements in purified & de-ionized water.
Electrolytes
$19.99
$19.99
Electrolytes truly are the “Spark of Life” as described in the book, "Electrolytes, the Spark of Life," by Gillian Martlew. While many of the known elements can be classified as Electrolytes, there are five elements recognized around the...
Bone Support
$19.99
$19.99
While most of us recognize Calcium as an important mineral for bone health, Calcium and other minerals represents only 20-40% of total bone mass and Calcium alone is not sufficient for proper bone health and strength. Trace elements, especially Silica,...
Immune Support
$19.99
$19.99
Eidon Immune Support is an incredibly effective formulation designed to support and maintain a healthy immune system. The blend of Zinc, Selenium, Sulfur and Silver is a combination optimized to give the body essential mineral nutrients to...
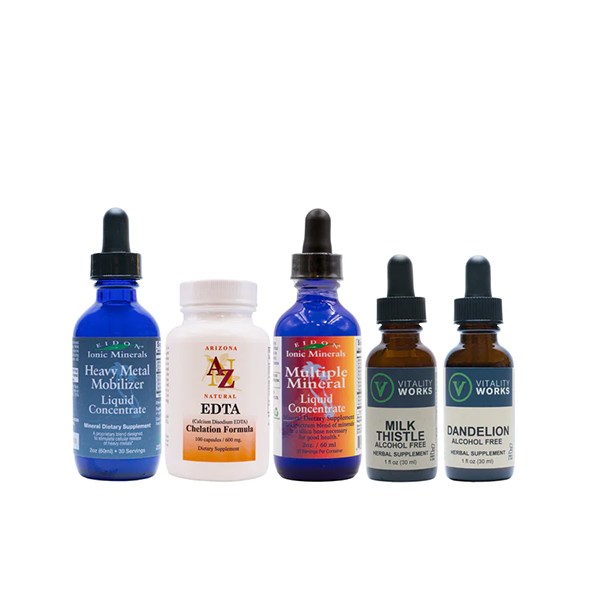
Heavy Metal Exposure & Cleansing Kit
$110.00
$110.00
This kit includes: Heavy Metal Mobilizer (2oz), EDTA (100 caps), Multiple Mineral (2oz), Milk Thistle Alcohol Free Tincture (1oz), Dandelion Alcohol Free Tincture (1oz). To read each step in detail, please view our full Heavy Metal Cleansing Protoco...
skin care
Our proprietary lotion and sunscreen formulations consist of Eidon liquid minerals, botanicals, and essential oils. They do not contain any harsh parabens, additives, or chemical preservatives.
Moisturizing Lotion
$24.00
$24.00
"Every time you apply make up, you lather your face with a deadly cocktail of carcinogens, preservatives, mutagens, allergens, toxic heavy metals, central nervous system disruptors and other poisons that slip through the loose regulatory net. Every day...
Mushrooms
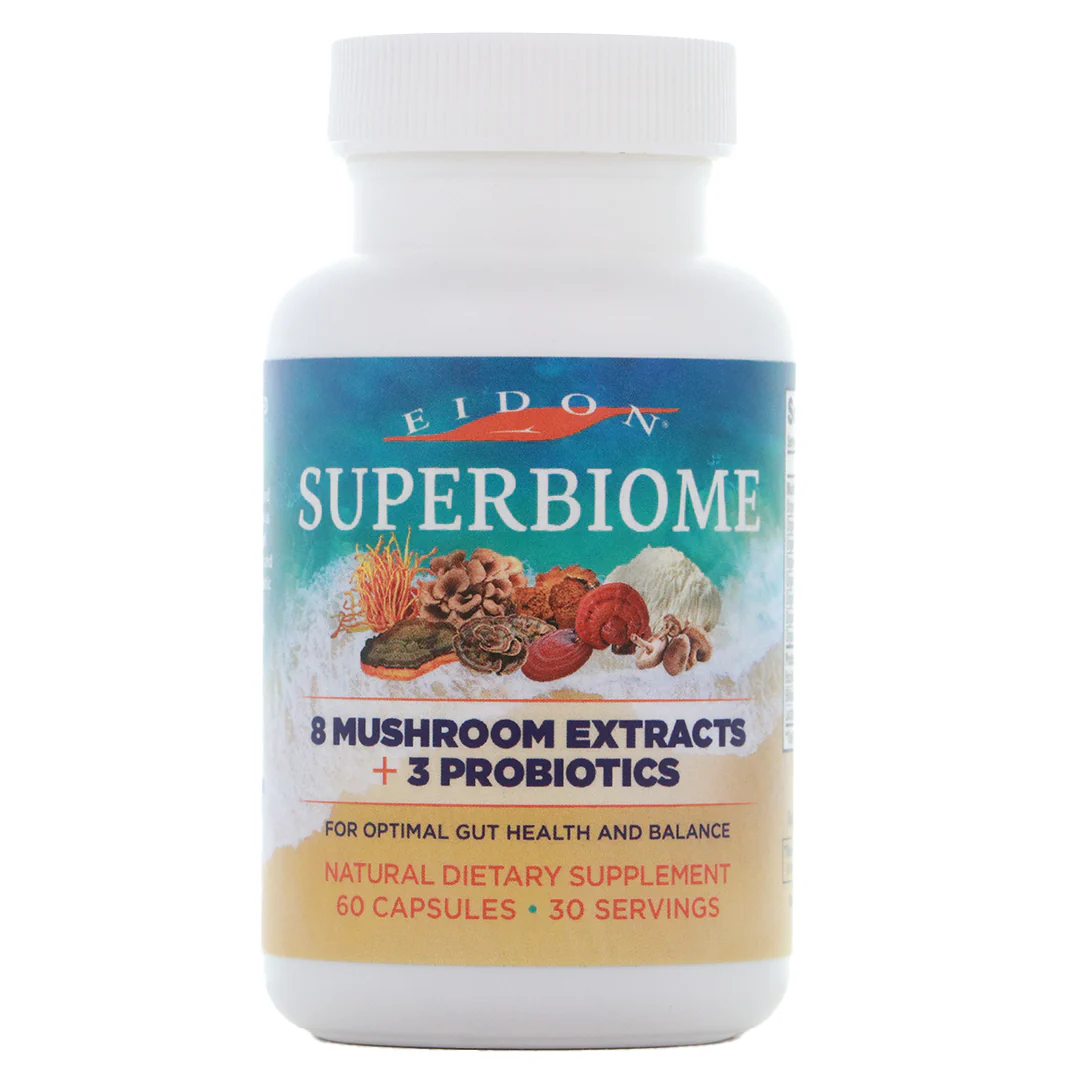
SuperBiome Mushroom Probiotic Capsules
$34.99
$34.99
Harness the ancient power of mushrooms to nurture your gut and balance your body naturally.
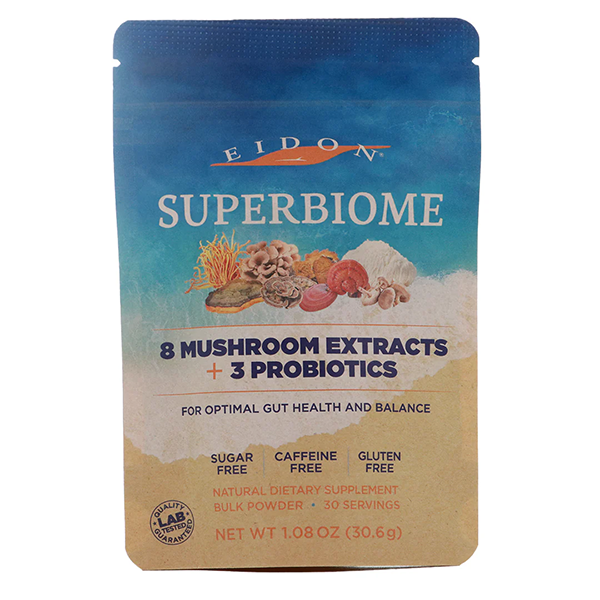
SuperBiome Mushroom
$29.99 - $94.97
$29.99 - $94.97
Not all mushrooms are created equal and our commitment to quality is what sets us apart. We have carefully sourced eight powerful, health-promoting mushrooms and combined them with two robust probiotic strains, delivering a balancing and regenerating blend that will optimize your microbiome...
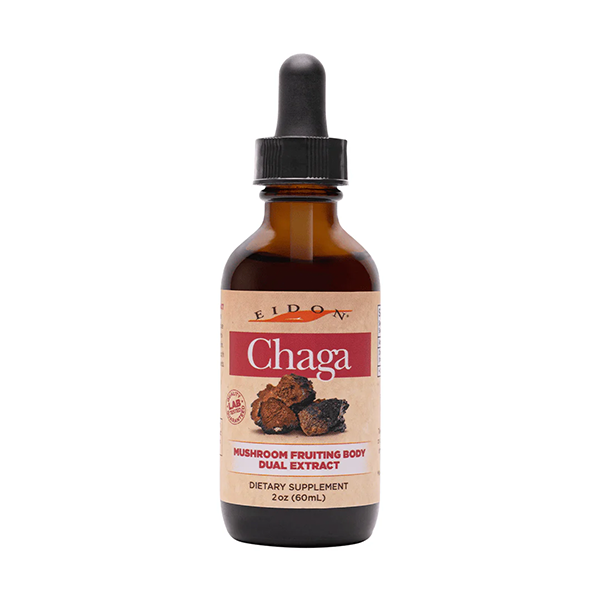
Chaga
$39.00
$39.00
Chaga is known as the King of Mushrooms in Siberia, where it has been used for centuries as a traditional medicinal tea. Chaga has a significant amount of beta glucans and betulinic acid...
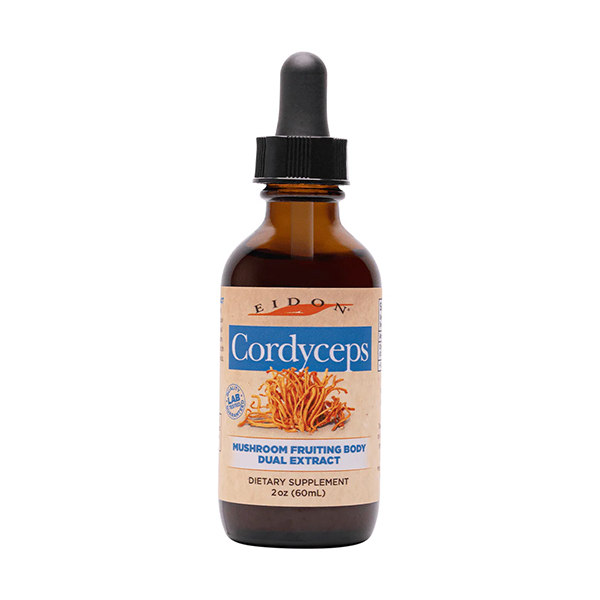
Cordyceps
$39.00
$39.00
Cordyceps is a highly prized mushroom that contains significant amounts of beta glucans and cordycepin. Traditional medicine practitioners have recommended Cordyceps as a powerful tonic in improving energy, appetite, stamina and endurance...
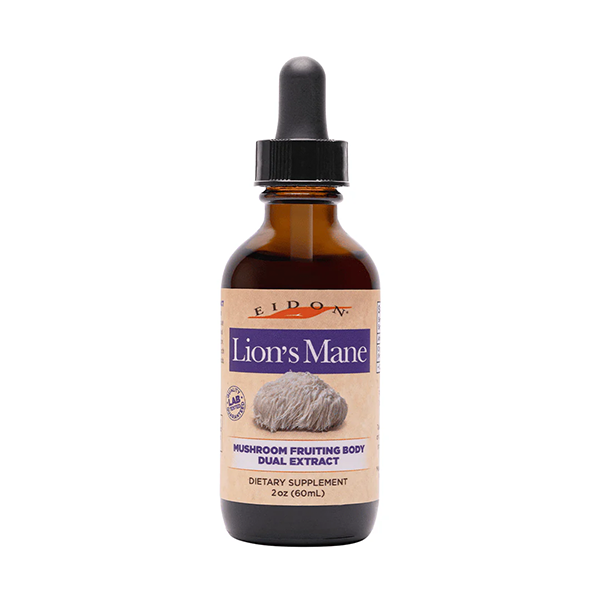
Lion's Mane
$39.00
$39.00
Lion's Mane is known as the mushroom for the mind! It grows in Northern forests on hardwood trees and has been used for millennia in traditional Chinese medicine...
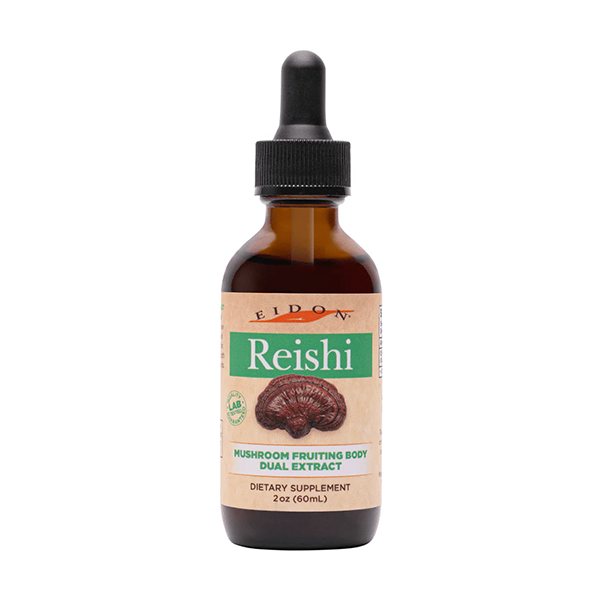
Reishi
$39.00
$39.00
Reishi is known as the "Mushroom of Immortality" and has been used for over 2000 years in China, most notably by the Taoist monks. Reishi mushrooms are high in beta glucans and loaded with beneficial triterpenes...
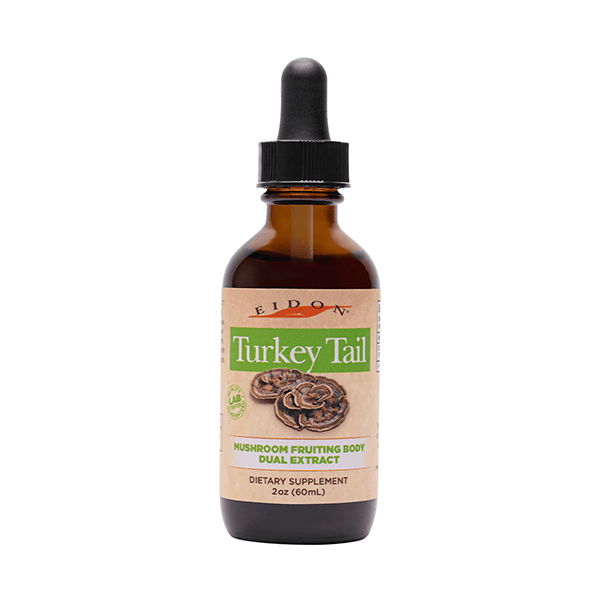
Turkey Tail
$39.00
$39.00
Turkey Tail mushroom is one of the most well-researched functional mushrooms. It grows on dead logs worldwide, and receives its name because of its stripes of brown and tan look like the tail feathers of a turkey...
Supplements
Fulfill other balance recommendations with our selection of supporting supplements.
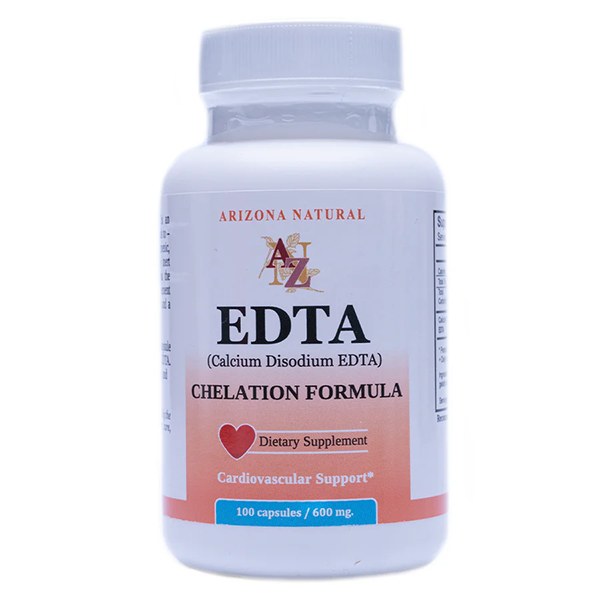
EDTA Chelation
$18.00
$18.00
EDTA is an acronym for the chemical compound Ethylenediaminetetraacetic acid. It is most commonly produced as a salt. Two compounds of importance are disodium EDTA and calcium disodium EDTA. Both of these compounds are effective in binding up other...
Taurine 1000
$15.00
$15.00
Taurine is a naturally occurring chemical compound found within animals as well as humans. It is produced from cysteine, an amino acid which contains Sulfur. In medical and scientific literature, Taurine is often referred to as an amino acid as it...
Multiple Vitamins
$15.00
$15.00
Uckele's BIO-V Multple Vitamin is a full spectrum, well balanced formulation especially designed to compliment and support the mineral balancing process. There are very strong relationships between vitamins and minerals to support and maintain...
Vitamin B Complex
$20.00
$20.00
*Same product with a new label. Vitality Works B Complex consists of 8 distinct vitamins known collectively as vitamin B complex. This group of vitamins work in tandem to strengthen immune function, promote a healthy nervous system, and normalize...
Cod Liver Oil
$39.00
$39.00
Cod liver oil is a wonderful nutritional supplement which provides multiple health benefits. Blue Ice Cod Liver Oil is processed using traditional tried and true methods of extracting the oil via fermentation rather than using chemical and/or mechanical...
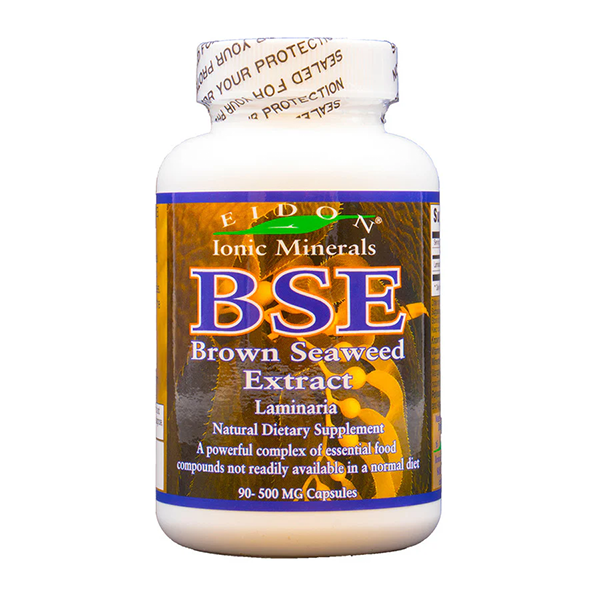
Brown Seaweed Extract
$25.00
$25.00
The planet's oceans are the birthplace of all life. It makes sense that the health giving properties of its aqueous mineral solution (known as seawater) and the plants that live in it would be imbued with life sustaining elements. Even our blood mimics...
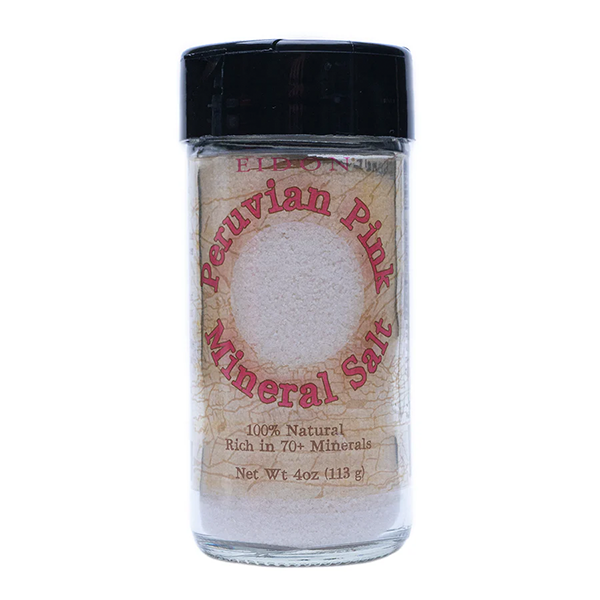
Peruvian Pink Salt
$6.50 - $15.00
$6.50 - $15.00
Peruvian Pink Salt is a natural salt that has been harvested by hand and used for well over 2,000 years. Salt water bubbles out of the ground from springs located over 11,000 feet...
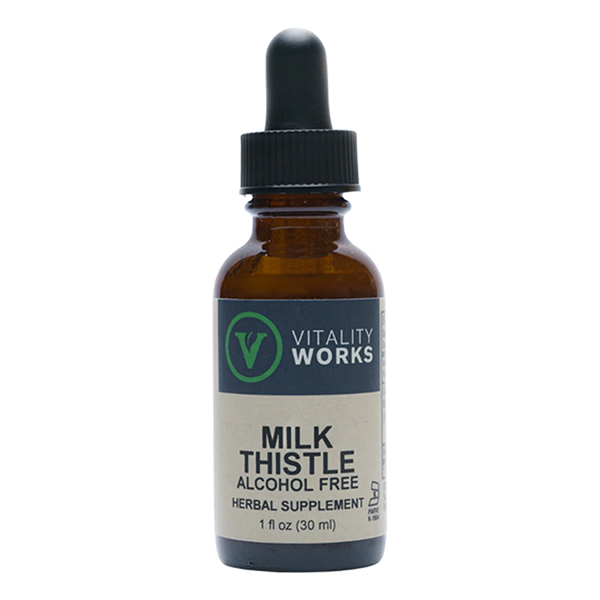
Milk Thistle
$14.00
$14.00
Supplementing with Milk Thistle is recommended in Step 5 of our Heavy Metal Exposure & Cleansing Protocol program. Milk Thistle provides you with herbal liver support so...
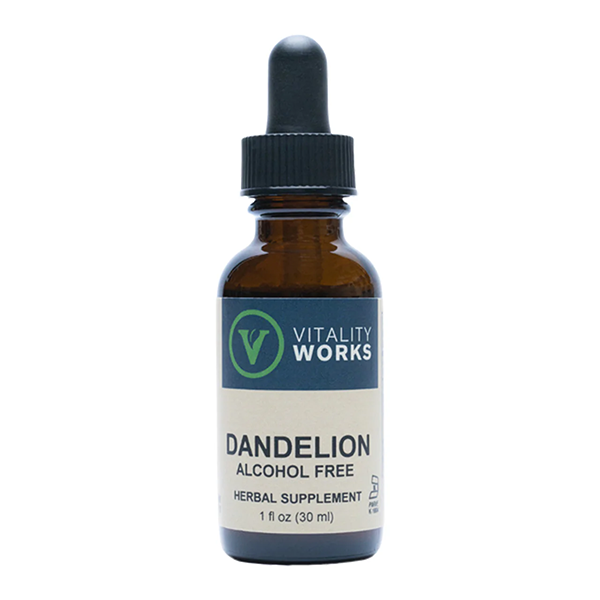
Dandelion
$14.80
$14.80
Dandelion Liquid Extract helps to support the kidneys. Supplementing with dandelion is recommended in Step 5 of our Heavy Metal Cleansing Protocol program, as the...
Books

Balance Your Terrain: A Guide to Optimal Health and Freedom from Disease
$24.00
$24.00
In "Balance Your Terrain: A Guide to Optimal Health and Freedom from Dis-ease," Rick Wagner offers a fresh take on health that's down-to-earth yet cosmic in scope. He dives into the idea that we're all connected to the vast universe, highlighting both our shared origins and our unique individuality. Wagner isn't afraid to challenge mainstream medicine, suggesting that true well-being comes from living in harmony with our bodies' natural rhythms rather than relying solely on interventions.

The Synergy Between Minerals
$25.00
$25.00
An essential guide to understanding how minerals work together to fuel your body’s most vital processes.
Chocolate
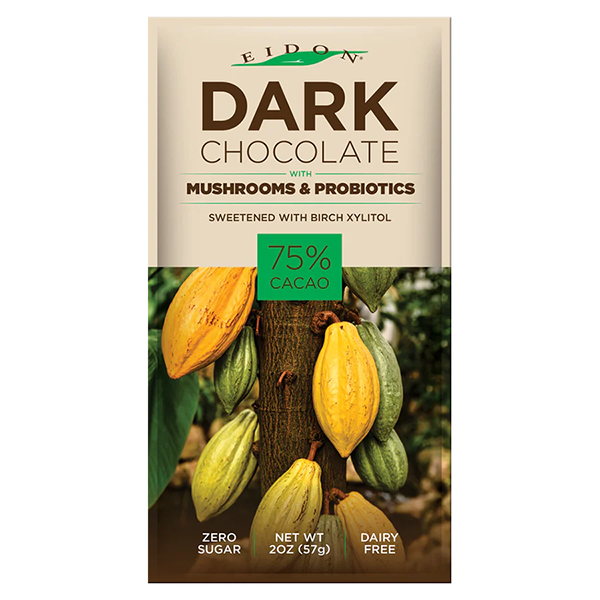
SuperBiome Chocolate
$7.99
$7.99
In the spirit of balance, Eidon is now offering a decadently healthy chocolate bar - with Mushrooms & Probiotics! Our chocolate is sweetened with xylitol and...
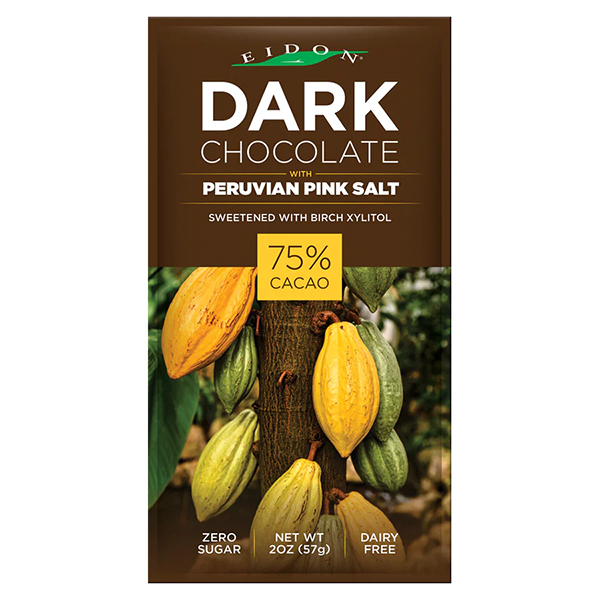
Peruvian Pink Salt Chocolate
$7.99
$7.99
In the spirit of balance, Eidon is introducing our newest product - a decadently guilt-free chocolate bar! Our chocolate is sweetened with xylitol from birch trees and enhanced with...
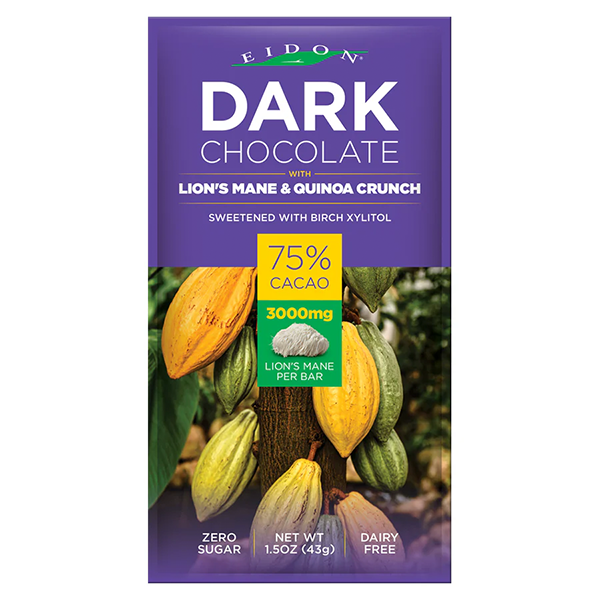
Lion's Mane & Quinoa Crunch Dark Chocolate Bar
$7.99
$7.99
Introducing Eidon’s NEW decadently healthy chocolate bar! Our 75% dark chocolate is perfectly sweetened with birch xylitol, infused with Lion’s Mane mushroom for increased mental clarity and gut health, and mixed with crispy quinoa.
Questions about our Minerals?
If you have questions about our products, please visit our FAQ page

© 2026- Eidon Ionic Minerals - All Rights Reserved. - Accessibility Statement
Powered by: 